
Goal
In this tutorial, you will learn about the different event representations available in EventCV and how to effectively utilise them.
Requirements
Please make sure you have installed EventCV using your preferred Python package manager.
You have an event stream file in one of the supported formats.
If you do not have an event file to work with, you can follow this tutorial along at our Google Colab to get hands on experience. Or you can download an example stream from N-ImageNet here.
What are event representations?
A standard event stream is a quadruple element with an x and a y coordinate, a timestamp t, and polarity p. Formally, you can represent a single event e as:
Events arrive sequentially from an event camera on a microsecond timescale and return as a list of events, which means depending on the camera and the environment 10’s or 100’s of thousands of events can be generated in a matter of seconds.
Therefore, for many computer vision tasks we often need to compress this information down into formats that make working with them intuitive and easy. These can be 2-dimensional or 3-dimensional formats that consolidate the list of events.
Simple event representations
EventCV handles the generation of many common event representations through simple function calls:
import eventcv as ecv

stream = ecv.load("example.npz")
stream_count = stream.count()

# view the example image
stream_count.view()

# print out the original and new dimensions
print(stream.numpy().shape)
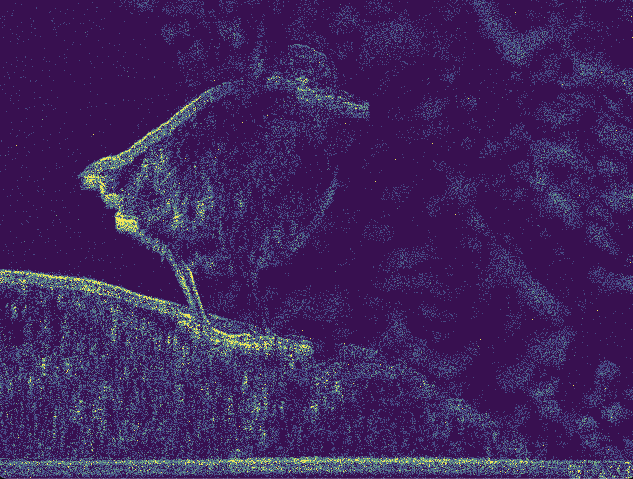
print(stream_count.numpy().shape)For example, when using the example.npz file we go from an array that is simply a quadruple list of events to an image based representation where at each pixel the events are counted and formed into the original sensor dimensions.
# original stream file shape
stream.shape = (106295, 4)

# count histrogram shape
stream_count.shape = (1, 480, 640)
The image below is what is returned when calling .view() on an event representation, a dedicated graphical rendering window will popup and display whichever representation used:
Within event representations, there are toggleable parameters depending on the type of representation being used. For example, with .count() we can normalize the counts between 0-255.
stream = ecv.load("example.npz")
stream_count = stream.count()
stream_count_norm = stream.count(normalize=True)

# view the example image
stream_count.numpy().max() # return max 30
stream_count_norm.numpy().max() # returns max 255The above .count() representation flattens the event count across polarities, if you want to preserve them then .flatten() can be used:
stream = ecv.load("example.npz")
stream_count = stream.count()    # creates histogram count
stream_flatten = stream.flatten()# creates polarity historgram count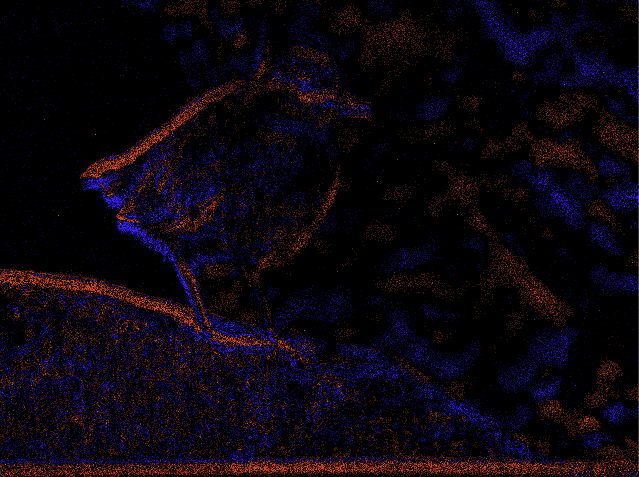
Using representations with open & load
Typically, you will be working with a single representation for your computer vision application. In this case, you can define which representation you want to load directly through ecv.open() or ecv.load().
For information on the difference between .open() and load(), please see the reading event files tutorial.
# load the event stream directly as a histogram count
stream_count = ecv.load("example.npz", repr="count")

# open the event stream directly as a histogram count
stream_count = ecv.open("example.npz", repr="count")By parsing the repr= argument in either .load() or .open(), we can easily define the event representation we wish to work with without needing to explicitly call it per slice.
For .open(), this will apply the representation when we parse the argument dt_ms= to perform lazy slicing:
# open the event stream with lazy slicing at 10 msec
stream_count = ecv.open("example.npz", dt_ms=10)
slice0 = stream_count.slice(0).count()

# open the event stream with lazy slicing and the count representation
stream_count = ecv.open("example.npz", dt_ms=10, repr="count")
slice0 = stream_count.slice(0)In the above, both instances of slice0 are equivelant.
Complex event representations
EventCV handles several complex 3-dimensional event representations seamlessly. These are called in exactly the same way as the count() and flatten() examples listed above.
# load the event stream as a voxel grid
stream_voxel = ecv.open("example.npz", repr="voxel")
print(stream_voxel.numpy().shape)

# load the event stream as an multi-channel time surface
stream_mcts = ecv.open("example.npz", repr="mcts")
print(stream_mcts.numpy().shape)Full list of representations available
For a full list of event representations, please visit the official documentation.
Recap
In this tutorial, we learned how to generate event-based representations directly and when using the load or open functions. EventCV covers the most common representations, where some representations have specific functions such as normalzing event counts.
The next tutorial covers working with filters and formatters available in EventCV to denoise and improve the event stream quality.